The PHP-FPM slow log is the most useful file on a slow PHP server and the least read, because it is a wall of stack traces. Each entry says which script was running and where it was stuck at the moment the timeout hit, but the answer you want, which plugin is hurting this pool, only appears after you have counted a few hundred of them. This script does the counting.
Table of Contents
It reads the slow logs, the FPM master error logs and the pool configs, finds them itself on cPanel (ea-php), DirectAdmin, AlmaLinux and Rocky (stock and Remi) and Debian or Ubuntu, and prints one report: what was slow, where it was waiting, which pools ran out of workers and how those pools are configured.
What the PHP-FPM slow log analyzer reports
- Slow requests by script (
script_filename), for exampleindex.phpversusadmin-ajax.phpversuswp-cron.php. - By top stack frame: the function, file and line PHP was in when the entry was written.
- By function:
curl_exec()means waiting on a remote API,mysqli_query()on the database,sleep()on deliberate delays,file_get_contents()often on a remote URL. - By WordPress plugin or theme: the innermost frame under
wp-content/plugins/,wp-content/themes/orwp-content/mu-plugins/in each trace. - By pool, so on cPanel you see which account the traffic belongs to.
- FPM error log events per pool:
server reached pm.max_children,seems busy,executing too slowandexecution timed out(requests killed byrequest_terminate_timeout), with the time of the last max_children hit. - Pool settings:
pm,pm.max_children,request_slowlog_timeout,request_terminate_timeoutand the slow log path for each pool, and a count of pools that never write a slow log.
Usage
curl -fsSL https://srvscripts.com/get/php-fpm-slowlog-analyzer/ -o php-fpm-slowlog-analyzer.sh
bash php-fpm-slowlog-analyzer.sh                       # everything found, all time
bash php-fpm-slowlog-analyzer.sh --since=2h            # the incident window only
bash php-fpm-slowlog-analyzer.sh --log /var/log/php-fpm/www-slow.log --top=20
bash php-fpm-slowlog-analyzer.sh --all-pools           # full settings table on big cPanel servers
Sample output
== Slow log entries: 29 ==

== By function it was stuck in ==
       18  curl_exec()
        7  mysqli_query()
        3  sleep()

== By WordPress plugin / theme (innermost in the stack) ==
       18  plugins/social-feed
        7  plugins/woocommerce
        3  mu-plugins/limit.php

== FPM error log events per pool ==
  POOL                             MAX_CHILDREN       BUSY       SLOW  TIMED_OUT  LAST_MAX_CHILDREN
  example_com                                 9          0          5          0  01-Oct-2026 09:22:50
  shop_net                                    0          1          0          1  -
  WARN  pool example_com reached pm.max_children 9 time(s)
  WARN  pool shop_net had 1 request(s) killed by request_terminate_timeout

== Pool settings ==
  POOL                             PM        MAX_CHILDREN  SLOWLOG_T TERMINATE_T SLOWLOG
  example_com                      ondemand  5             5s        -          /opt/cpanel/ea-php81/root/usr/var/log/php-fpm/slow.log
  shop_net                         dynamic   20            unset     60         -
Most of the slow requests on example_com are waiting in curl_exec() inside a social feed plugin: a remote API that answers slowly, called on every page view. Five workers stuck on that API is exactly why the pool hit pm.max_children nine times. Raising max_children would only let more workers wait. The fix is to cache the feed or load it in the background. shop_net has no slow log configured, so its killed request cannot be traced until request_slowlog_timeout is set. When the stuck function is mysqli_query(), look at the database with the MySQL health snapshot.
Tested on a real server
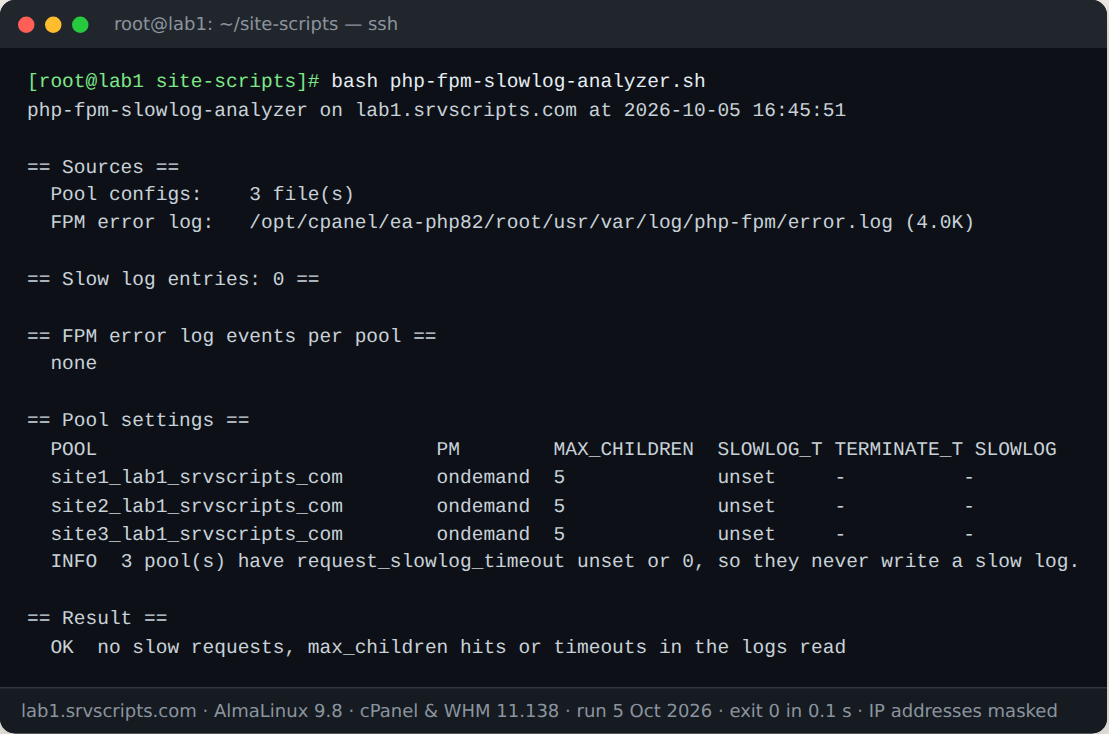
We ran this script on our lab server on 5 October 2026: AlmaLinux 9.8 with cPanel & WHM 11.138, MariaDB 10.11 and three WordPress test accounts. The screenshot is the real terminal output; only IP addresses are masked.
Options
--log FILE— slow log to read (repeatable); turns off slow log auto-detection.--error-log FILE— FPM master error log to read (repeatable).--since=DUR— only entries newer than30m,2h,7d; default is everything in the files.--top=N— lines per section (default 10).--all-pools— show every pool in the settings table; by default, servers with more than 30 pools show only pools with events.
Notes
Read-only. Nothing is reloaded or changed. Slow log entries only exist for pools with request_slowlog_timeout above zero; the PHP-FPM configuration reference explains it and the related slowlog and request_terminate_timeout settings. A value of 5s is a sensible start: long enough to skip normal pages, short enough to catch the bad ones.
LiteSpeed: sites served by lsphp through LSAPI do not use PHP-FPM, so they produce no slow log and will not appear here. When LiteSpeed is detected the script says so; for those sites use LSAPI’s own slow request setting (LSAPI_SLOW_REQ_MSECS on the lsphp external app) or the real-time stats in the WebAdmin console.
Timestamps in FPM logs have no time zone and are read as server local time.
PHP-FPM slow log at a glance
Official documentation: DirectAdmin documentation, cPanel & WHM documentation, AlmaLinux wiki.
Related guides: Disk full on a production server: recovery runbook · Best VPS for cPanel and DirectAdmin in 2026: What to Check · CSF Fork 2026: Which Reliable Replacement After ConfigServer?.
The script
#!/usr/bin/env bash
# PHP-FPM Slow Log Analyzer (v1.0.0) - from srvScripts.com
# Source, docs and updates: https://srvscripts.com/scripts/php-fpm-slowlog-analyzer/
# Copyright (c) 2026 srvScripts.com. MIT licence: if you copy, share or adapt this script, keep this notice and credit srvScripts.com.
# php-fpm-slowlog-analyzer.sh — group PHP-FPM slow log entries by script, stack frame and plugin, and count max_children hits per pool
# https://srvscripts.com/scripts/php-fpm-slowlog-analyzer/   License: MIT
#
# Read-only. Finds slow logs, FPM error logs and pool configs on cPanel (ea-php),
# DirectAdmin, AlmaLinux/Rocky (stock and Remi) and Debian/Ubuntu, or reads the files you give.
#   bash php-fpm-slowlog-analyzer.sh                   # everything found, all time
#   bash php-fpm-slowlog-analyzer.sh --since=2h        # only the last two hours
#   bash php-fpm-slowlog-analyzer.sh --log /var/log/php-fpm/www-slow.log --top=20
set -uo pipefail
export LC_ALL=C

usage() {
  cat <<'EOF'
Usage: php-fpm-slowlog-analyzer.sh [options]

Options:
  --log FILE        slow log to read (repeatable; disables auto-detection of slow logs)
  --error-log FILE  FPM error log to read (repeatable; disables auto-detection of error logs)
  --since=DUR       only entries newer than DUR: 30m, 2h, 7d (default: everything in the files)
  --top=N           lines per section (default 10)
  --all-pools       list every pool in the settings table, not only busy ones
  --no-color        plain output even on a terminal
  -h, --help        show this help

Exit codes: 0 nothing found, 1 slow requests or max_children/timeouts found,
            2 usage error or no PHP-FPM logs to read
EOF
}

SLOW=(); ERRL=(); SINCE=''; TOP=10; ALLPOOLS=0; COLOR=1
while (( $# )); do
  case $1 in
    --log) SLOW+=("${2:-}"); shift ;;
    --log=*) SLOW+=("${1#*=}") ;;
    --error-log) ERRL+=("${2:-}"); shift ;;
    --error-log=*) ERRL+=("${1#*=}") ;;
    --since) SINCE=${2:-}; shift ;;
    --since=*) SINCE=${1#*=} ;;
    --top) TOP=${2:-}; shift ;;
    --top=*) TOP=${1#*=} ;;
    --all-pools) ALLPOOLS=1 ;;
    --no-color) COLOR=0 ;;
    -h|--help) usage; exit 0 ;;
    *) echo "Unknown option: $1 (see --help)" >&2; exit 2 ;;
  esac
  shift
done
[[ $TOP =~ ^[0-9]+$ ]] || { echo "--top needs a number" >&2; exit 2; }
SECS=0
if [[ -n $SINCE ]]; then
  [[ $SINCE =~ ^([0-9]+)([mhd])$ ]] || { echo "Bad --since value: $SINCE (use 30m, 2h, 7d)" >&2; exit 2; }
  case ${BASH_REMATCH[2]} in m) SECS=$(( BASH_REMATCH[1] * 60 )) ;; h) SECS=$(( BASH_REMATCH[1] * 3600 )) ;; d) SECS=$(( BASH_REMATCH[1] * 86400 )) ;; esac
fi
for f in "${SLOW[@]}" "${ERRL[@]}"; do [[ -r $f ]] || { echo "Cannot read $f" >&2; exit 2; }; done

C_WARN=''; C_OFF=''
[[ -t 1 && $COLOR -eq 1 ]] && { C_WARN=$'\e[33m'; C_OFF=$'\e[0m'; }
hr()   { printf '\n== %s ==\n' "$*"; }
warn() { printf '  %sWARN%s  %s\n' "$C_WARN" "$C_OFF" "$*"; }

# ---- pool configs: one TSV row per pool ------------------------------------------------
shopt -s nullglob
CONFS=(/opt/cpanel/ea-php*/root/etc/php-fpm.d/*.conf /etc/php-fpm.d/*.conf /etc/opt/remi/php*/php-fpm.d/*.conf
       /etc/php/*/fpm/pool.d/*.conf /usr/local/php*/etc/php-fpm.d/*.conf)
MAINCONFS=(/opt/cpanel/ea-php*/root/etc/php-fpm.conf /etc/php-fpm.conf /etc/opt/remi/php*/php-fpm.conf
           /etc/php/*/fpm/php-fpm.conf /usr/local/php*/etc/php-fpm.conf)
POOLS=''
if (( ${#CONFS[@]} )); then
  # columns: pool, pm, max_children, request_slowlog_timeout, request_terminate_timeout, slowlog, file
  POOLS=$(awk '
    function nz(x) { return (x == "") ? "-" : x }
    function out() { if (pool != "" && pool != "global") { gsub(/\$pool/, pool, sl)
      printf "%s\t%s\t%s\t%s\t%s\t%s\t%s\n", pool, nz(v["pm"]), nz(v["pm.max_children"]), nz(v["request_slowlog_timeout"]), nz(v["request_terminate_timeout"]), nz(sl), file } }
    FNR == 1 { out(); pool = ""; file = FILENAME }
    /^[ \t]*[;#]/ { next }
    /^[ \t]*\[[^]]+\]/ { out(); pool = $0; gsub(/^[ \t]*\[|\].*$/, "", pool)
      v["pm"] = "-"; v["pm.max_children"] = "-"; v["request_slowlog_timeout"] = "unset"; v["request_terminate_timeout"] = "-"; sl = "-"; next }
    /=/ { k = $0; sub(/=.*/, "", k); gsub(/[ \t]/, "", k)
      val = $0; sub(/^[^=]*=[ \t]*/, "", val); sub(/[ \t]*;.*$/, "", val); gsub(/"/, "", val)
      if (k in v) v[k] = val; else if (k == "slowlog") sl = val }
    END { out() }' "${CONFS[@]}" 2>/dev/null | sort -u)
fi

# ---- find logs ---------------------------------------------------------------------------
add_unique() { local x; for x in "${@:2}"; do [[ $x == "$1" ]] && return; done; return 1; }
if (( ${#SLOW[@]} == 0 )); then
  fromconf=()
  [[ -n $POOLS ]] && mapfile -t fromconf < <(cut -f6 <<<"$POOLS" | grep '^/' | sort -u)
  for f in /opt/cpanel/ea-php*/root/usr/var/log/php-fpm/*slow* /var/log/php-fpm/*slow* /var/log/php*-fpm*slow*.log \
           /var/opt/remi/php*/log/php-fpm/*slow* /usr/local/php*/var/log/*slow* "${fromconf[@]}"; do
    [[ -f $f && -r $f && $f != *.gz ]] || continue
    add_unique "$(readlink -f "$f")" "${SLOW[@]}" || SLOW+=("$(readlink -f "$f")")
  done
fi
if (( ${#ERRL[@]} == 0 )); then
  fromconf=()
  (( ${#MAINCONFS[@]} )) && mapfile -t fromconf < <(awk -F= '/^[ \t]*error_log[ \t]*=/ { v = $2; gsub(/[ \t";]/, "", v); if (v ~ /^\//) print v }' "${MAINCONFS[@]}" 2>/dev/null)
  for f in /opt/cpanel/ea-php*/root/usr/var/log/php-fpm/error.log /var/log/php-fpm/error.log /var/log/php*-fpm.log \
           /var/opt/remi/php*/log/php-fpm/error.log /usr/local/php*/var/log/php-fpm.log "${fromconf[@]}"; do
    [[ -f $f && -r $f ]] || continue
    add_unique "$(readlink -f "$f")" "${ERRL[@]}" || ERRL+=("$(readlink -f "$f")")
  done
fi
shopt -u nullglob

# LiteSpeed runs PHP through lsphp (LSAPI), which has no FPM slow log.
LSPHP=0
if [[ -d /usr/local/lsws ]] || pgrep -x lsphp >/dev/null 2>&1; then LSPHP=1; fi
lsphp_note() {
  hr "LiteSpeed / lsphp"
  echo "  INFO  LiteSpeed is present. Sites it serves with lsphp (LSAPI) do not write PHP-FPM slow logs,"
  echo "        so they will not appear above. For those, set the LSAPI_SLOW_REQ_MSECS environment variable"
  echo "        on the lsphp external app (lsphp then logs requests slower than that many milliseconds),"
  echo "        watch the real-time stats page in the WebAdmin console, or profile a copy of the site."
}

echo "php-fpm-slowlog-analyzer on $(hostname) at $(date '+%F %T')${SINCE:+  (window: last $SINCE)}"
hr "Sources"
echo "  Pool configs:    ${#CONFS[@]} file(s)"
for f in "${SLOW[@]}"; do printf '  Slow log:        %s (%s)\n' "$f" "$(du -h "$f" | cut -f1)"; done
for f in "${ERRL[@]}"; do printf '  FPM error log:   %s (%s)\n' "$f" "$(du -h "$f" | cut -f1)"; done
if (( ${#SLOW[@]} + ${#ERRL[@]} == 0 )); then
  echo "  No PHP-FPM slow logs or error logs found. Use --log / --error-log."
  (( LSPHP )) && { lsphp_note; exit 0; }
  exit 2
fi

# Shared awk helpers: FPM timestamps look like [01-Oct-2026 10:15:32] in server local time.
NOWF=$(date '+%Y %m %d %H %M %S')
AWK_TIME='
function days(y, m, d) { if (m <= 2) { y--; m += 12 }
  return 365*y + int(y/4) - int(y/100) + int(y/400) + int((153*(m-3)+2)/5) + d - 719469 }
function fpmtime(s,   mo) { mo = (index("JanFebMarAprMayJunJulAugSepOctNovDec", substr(s, 5, 3)) + 2) / 3
  return days(substr(s, 9, 4) + 0, mo, substr(s, 2, 2) + 0) * 86400 + substr(s, 14, 2) * 3600 + substr(s, 17, 2) * 60 + substr(s, 20, 2) }
function isstamp(s) { return s ~ /^\[[0-9][0-9]-[A-Z][a-z][a-z]-[0-9][0-9][0-9][0-9] [0-9][0-9]:/ }
function poolof(s) { if (match(s, /\[pool [^]]+\]/)) return substr(s, RSTART + 6, RLENGTH - 7); return "?" }
BEGIN { split(nowf, n, " "); cutoff = (secs > 0) ? days(n[1], n[2], n[3]) * 86400 + n[4] * 3600 + n[5] * 60 + n[6] - secs : 0 }
'
PROBLEMS=0

# ---- slow log: one TSV line per entry: pool, script, top frame, function, plugin/theme --
ENTRIES=''
if (( ${#SLOW[@]} )); then
  ENTRIES=$(cat -- "${SLOW[@]}" | awk -v nowf="$NOWF" -v secs="$SECS" "$AWK_TIME"'
    function flush() { if (have && keep) printf "%s\t%s\t%s\t%s\t%s\n", pool, (script == "" ? "?" : script), (frame == "" ? "?" : frame), (fn == "" ? "?" : fn), (plug == "" ? "-" : plug); have = 0 }
    isstamp($0) && /\[pool / { flush(); have = 1; keep = (fpmtime($0) >= cutoff); pool = poolof($0); script = frame = fn = plug = ""; next }
    /^script_filename = / { script = substr($0, 19); next }
    /^\[0x[0-9a-f]+\] / { line = substr($0, index($0, "] ") + 2)
      if (frame == "") { frame = line; fn = line; sub(/ .*/, "", fn) }
      if (plug == "" && match(line, /wp-content\/(mu-plugins|plugins|themes)\/[^\/]+/)) { plug = substr(line, RSTART + 11, RLENGTH - 11); sub(/:[0-9]+$/, "", plug) }
      next }
    END { flush() }')
fi
top() { sort | uniq -c | sort -rn | head -n "$TOP" | awk '{ c = $1; sub(/^ *[0-9]+ /, ""); printf "  %7d  %s\n", c, substr($0, 1, 150) } END { if (NR == 0) print "  none" }'; }
NENT=$( [[ -n $ENTRIES ]] && grep -c . <<<"$ENTRIES" || echo 0)

hr "Slow log entries: $NENT"
if (( NENT > 0 )); then
  PROBLEMS=1
  hr "By script (script_filename)";                        cut -f2 <<<"$ENTRIES" | top
  hr "By top stack frame (where it was when logged)";      cut -f3 <<<"$ENTRIES" | top
  hr "By function it was stuck in";                        cut -f4 <<<"$ENTRIES" | top
  hr "By WordPress plugin / theme (innermost in the stack)"; cut -f5 <<<"$ENTRIES" | grep -v '^-$' | top
  hr "By pool";                                            cut -f1 <<<"$ENTRIES" | top
fi

# ---- FPM error logs: per-pool counts ------------------------------------------------------
EVENTS=''
if (( ${#ERRL[@]} )); then
  # columns: pool, max_children hits, seems busy, executing too slow, timed out, last max_children time
  EVENTS=$(cat -- "${ERRL[@]}" | awk -v nowf="$NOWF" -v secs="$SECS" "$AWK_TIME"'
    !isstamp($0) || fpmtime($0) < cutoff { next }
    /server reached pm.max_children/ { p = poolof($0); mc[p]++; seen[p] = 1; last[p] = substr($0, 2, 20) }
    /seems busy/                    { p = poolof($0); busy[p]++; seen[p] = 1 }
    /executing too slow/            { p = poolof($0); slow[p]++; seen[p] = 1 }
    /execution timed out/           { p = poolof($0); tmo[p]++; seen[p] = 1 }
    END { for (p in seen) printf "%s\t%d\t%d\t%d\t%d\t%s\n", p, mc[p], busy[p], slow[p], tmo[p], (p in last ? last[p] : "-") }' | sort -t$'\t' -k2,2nr -k5,5nr)
  hr "FPM error log events per pool"
  if [[ -z $EVENTS ]]; then
    echo "  none"
  else
    printf '  %-32s %12s %10s %10s %10s  %s\n' POOL MAX_CHILDREN BUSY SLOW TIMED_OUT LAST_MAX_CHILDREN
    head -n "$TOP" <<<"$EVENTS" | awk -F'\t' '{ printf "  %-32s %12s %10s %10s %10s  %s\n", substr($1, 1, 32), $2, $3, $4, $5, $6 }'
    while IFS=$'\t' read -r p mc _ _ tmo _; do
      (( mc > 0 )) && { warn "pool $p reached pm.max_children $mc time(s)"; PROBLEMS=1; }
      (( tmo > 0 )) && { warn "pool $p had $tmo request(s) killed by request_terminate_timeout"; PROBLEMS=1; }
    done <<<"$EVENTS"
  fi
fi

# ---- pool settings ------------------------------------------------------------------------
hr "Pool settings"
if [[ -z $POOLS ]]; then
  echo "  skipped: no pool configs found in the usual places"
else
  total=$(grep -c . <<<"$POOLS")
  busy_pools=$( { cut -f1 <<<"$EVENTS"; [[ -n $ENTRIES ]] && cut -f1 <<<"$ENTRIES"; } | grep -v '^$' | sort -u)
  printf '  %-32s %-9s %-13s %-9s %-10s %s\n' POOL PM MAX_CHILDREN SLOWLOG_T TERMINATE_T SLOWLOG
  shown=0
  while IFS=$'\t' read -r p pm mc st tt sl _; do
    if (( ! ALLPOOLS && total > 30 )) && ! grep -qxF -- "$p" <<<"$busy_pools"; then continue; fi
    printf '  %-32s %-9s %-13s %-9s %-10s %s\n' "${p:0:32}" "$pm" "$mc" "$st" "$tt" "$sl"
    shown=$((shown + 1))
  done <<<"$POOLS"
  (( shown < total )) && echo "  ($shown of $total pools shown: only pools with events; use --all-pools for all)"
  noslow=$(awk -F'\t' '$4 == "unset" || $4 ~ /^0[smh]?$/' <<<"$POOLS" | wc -l)
  (( noslow > 0 )) && echo "  INFO  $noslow pool(s) have request_slowlog_timeout unset or 0, so they never write a slow log."
fi

(( LSPHP )) && lsphp_note

hr "Result"
if (( PROBLEMS )); then echo "  Slow requests or FPM limits found (see above)."; exit 1; fi
echo "  OK  no slow requests, max_children hits or timeouts in the logs read"
exit 0
25aa4dada13114af67628d0d2879b672dc62f4414b339c59fb4239561fb5e26dcurl -fsSL -o php-fpm-slowlog-analyzer.sh https://scr.srvscripts.com/php-fpm-slowlog-analyzer/php-fpm-slowlog-analyzer.sh && curl -fsSL https://scr.srvscripts.com/php-fpm-slowlog-analyzer/php-fpm-slowlog-analyzer.sh.sha256 | sha256sum -cInvoke-WebRequest -Uri 'https://scr.srvscripts.com/php-fpm-slowlog-analyzer/php-fpm-slowlog-analyzer.sh' -OutFile 'php-fpm-slowlog-analyzer.sh'; if ((Get-FileHash 'php-fpm-slowlog-analyzer.sh' -Algorithm SHA256).Hash -eq '25AA4DADA13114AF67628D0D2879B672DC62F4414B339C59FB4239561FB5E26D') { 'OK: the file is intact' } else { 'MISMATCH: do not run this file' }curl and sha256sum are not the Linux tools, so use the PowerShell line there.Also on GitHub: github.com/srvscripts/scripts
Frequently asked questions
Where are the slow logs on cPanel?
The script reads the slowlog path from each pool file in /opt/cpanel/ea-phpXX/root/etc/php-fpm.d/ and also checks /opt/cpanel/ea-phpXX/root/usr/var/log/php-fpm/. The master error log with max_children warnings is error.log in the same directory.
Should I just raise pm.max_children?
Only after checking what the workers are waiting on. If they wait on a remote API or a locked table, more workers means more waiting and more memory; fix the slow code first.
Does the slow log slow PHP down?
Barely. PHP-FPM only traces a request once it has already exceeded request_slowlog_timeout, so normal requests are untouched.
Why is the plugin column empty for some entries?
The stack had no frame inside wp-content, so the time was spent in WordPress core, in a non-WordPress script, or in code loaded from elsewhere.