What it is for
mysqltuner is great but it is 2,000 lines of Perl and its advice needs interpreting. When a server is slow you want a handful of ratios and the top ten tables, in ten seconds, without installing anything. That is this script.
Table of Contents
Usage
curl -fsSL https://srvscripts.com/get/mysql-health-snapshot/ -o mysql-health-snapshot.sh
bash mysql-health-snapshot.sh
bash mysql-health-snapshot.sh --top 20
MYSQL_ARGS="-h db1 -u admin -p" bash mysql-health-snapshot.sh
Sample output
== Connections ==
  Threads connected / max used / limit   38 / 151 / 151
  !! max_used_connections is 151 of 151  raise max_connections or fix the app that holds connections
  Threads_created per connection         0.8%  (high = raise thread_cache_size)

== InnoDB ==
  Buffer pool size                       0.12 GB
  Buffer pool hit ratio                  96.40%  (want > 99% on a warmed-up server)
  InnoDB data+index on disk              3.81 GB  (larger than the buffer pool)

== Queries ==
  Slow queries                           4127  (slow_query_log=ON, long_query_time=2s)
  Created tmp disk tables                31.2% of tmp tables went to disk
Three findings, in the order you should fix them: the connection limit was hit (see the Too many connections guide), the buffer pool is the cPanel default 128 MB on a server with 4 GB of data, and a third of temporary tables spill to disk — usually tmp_table_size/max_heap_table_size too small or TEXT columns in GROUP BY queries.
Tested on a real server
We ran this script on our lab server on 5 October 2026: AlmaLinux 9.8 with cPanel & WHM 11.138, MariaDB 10.11 and three WordPress test accounts. The screenshot is the real terminal output; only IP addresses are masked.
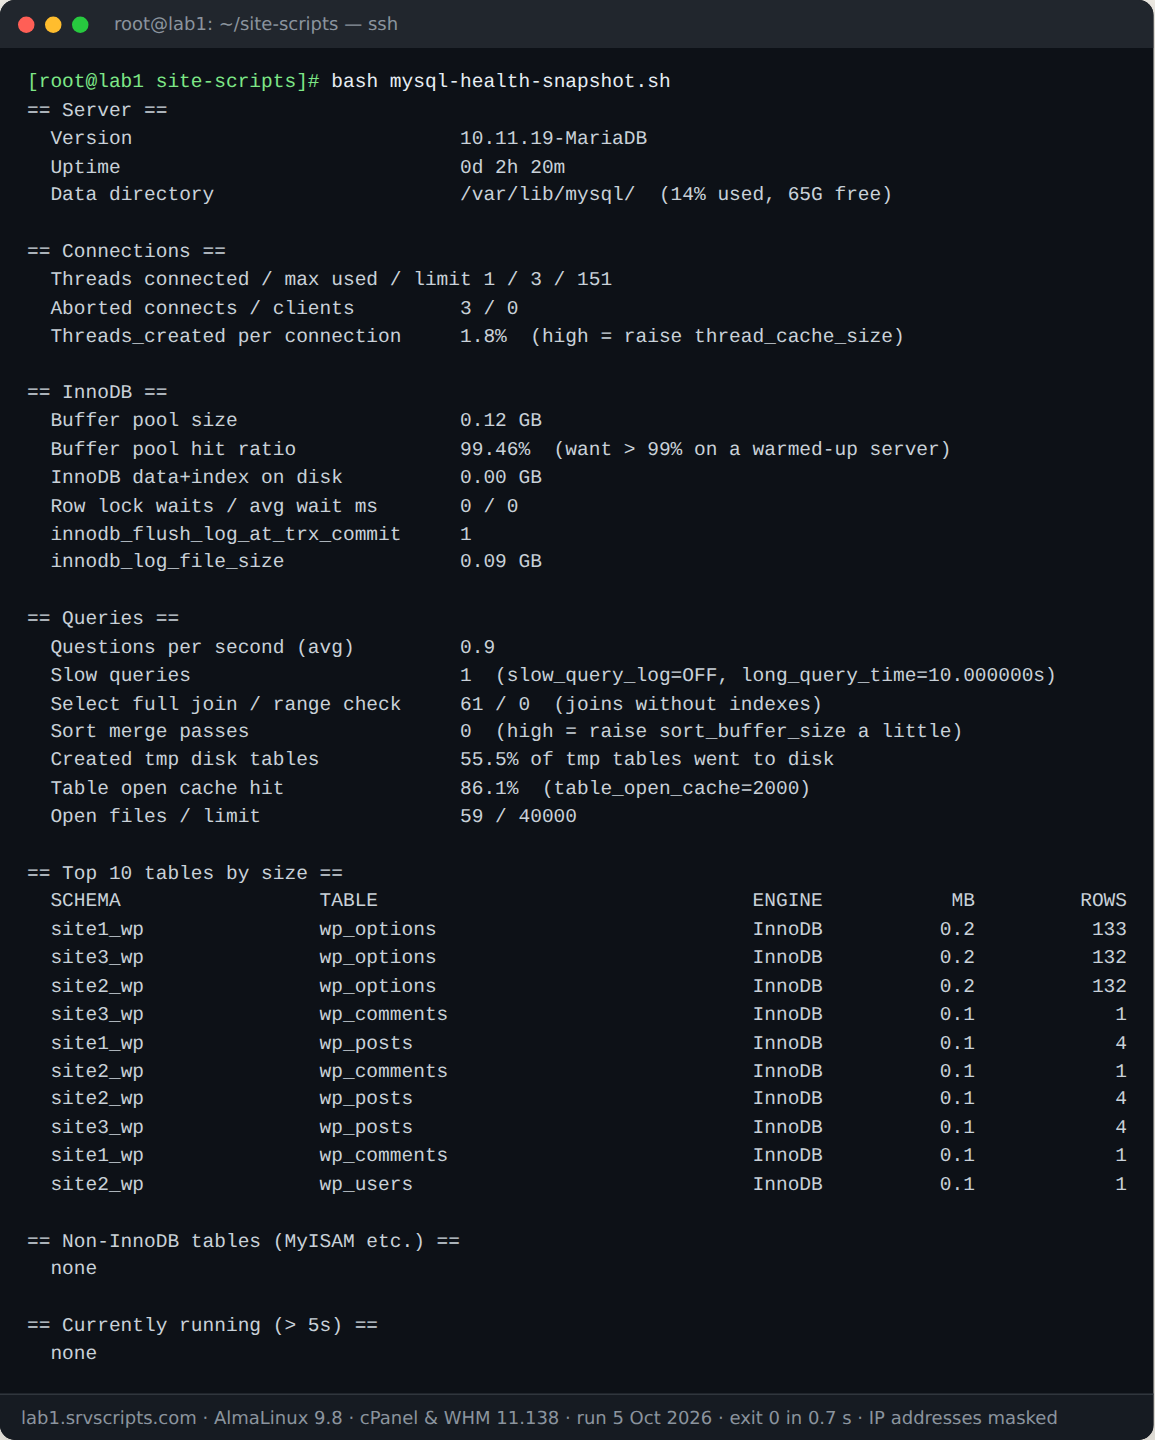
What each section means
- Buffer pool hit ratio below 99% on a server that has been up for a day means InnoDB is reading from disk; set
innodb_buffer_pool_sizeto 50–70% of RAM on a dedicated DB server, or 25% on a cPanel box that also runs PHP. - Threads_created per connection above 5% means the thread cache is too small;
thread_cache_size=32is a safe start. - Created tmp disk tables above 25% points at queries sorting large text columns; raise
tmp_table_sizeandmax_heap_table_sizetogether (they are capped by the lower one) to 64M–256M. - Non-InnoDB tables lists MyISAM leftovers, which take table-level locks and are not crash-safe; convert with
ALTER TABLE t ENGINE=InnoDBduring a quiet hour. - Currently running shows queries older than five seconds with their state; a
Sending datastate on a WordPresswp_optionsquery means an autoloaded-options problem, not a database problem.
MySQL health snapshot at a glance
Official documentation: MariaDB documentation, cPanel & WHM documentation, AlmaLinux wiki.
Related guides: MariaDB won’t start after an upgrade: InnoDB recovery, mariadb-upgrade and sql_mode issues · Account quotas show “unlimited”: fixquotas and XFS/ext4 quota repair on cPanel · Tuning InnoDB on MariaDB 11/12 for cPanel shared hosting: buffer pool, redo log and I/O.
The script
#!/usr/bin/env bash
# MySQL Health Snapshot Script: Free 10-Second MariaDB Check (v1.0.0) - from srvScripts.com
# Source, docs and updates: https://srvscripts.com/scripts/mysql-health-snapshot/
# Copyright (c) 2026 srvScripts.com. MIT licence: if you copy, share or adapt this script, keep this notice and credit srvScripts.com.
# mysql-health-snapshot.sh — one-page health check for MariaDB / MySQL
# https://srvscripts.com/scripts/mysql-health-snapshot/   License: MIT
#
# Read-only. Uses the mysql client with whatever credentials it already has
# (root on cPanel via /root/.my.cnf, or pass --defaults-file / -u -p yourself).
#   bash mysql-health-snapshot.sh
#   bash mysql-health-snapshot.sh --top 15          # more tables in the size list
#   MYSQL_ARGS="-u admin -p" bash mysql-health-snapshot.sh
set -u
TOP=10; [[ "${1:-}" == "--top" ]] && TOP=${2:-10}
M="mysql ${MYSQL_ARGS:-} -N -B"
$M -e 'SELECT 1' >/dev/null 2>&1 || { echo "Cannot connect with 'mysql ${MYSQL_ARGS:-}'. Set MYSQL_ARGS." >&2; exit 1; }

st() { $M -e "SHOW GLOBAL STATUS LIKE '$1'" 2>/dev/null | awk '{print $2}'; }
vr() { $M -e "SHOW GLOBAL VARIABLES LIKE '$1'" 2>/dev/null | awk '{print $2}'; }
pct() { awk -v a="${1:-0}" -v b="${2:-1}" 'BEGIN{ if (b==0) b=1; printf "%.1f", a*100/b }'; }
gb() { awk -v b="${1:-0}" 'BEGIN{printf "%.2f", b/1073741824}'; }
hr() { printf '\n== %s ==\n' "$*"; }
line() { printf '  %-34s %s\n' "$1" "$2"; }

hr "Server"
line "Version" "$($M -e 'SELECT VERSION()')"
up=$(st Uptime); line "Uptime" "$(( up/86400 ))d $(( up%86400/3600 ))h $(( up%3600/60 ))m"
line "Data directory" "$(vr datadir)  ($(df -hP "$(vr datadir)" | awk 'NR==2{print $5" used, "$4" free"}'))"

hr "Connections"
mc=$(vr max_connections); mu=$(st Max_used_connections); tc=$(st Threads_connected)
line "Threads connected / max used / limit" "$tc / $mu / $mc"
(( mu*100/mc >= 85 )) && line "  !! max_used_connections is ${mu} of ${mc}" "raise max_connections or fix the app that holds connections"
line "Aborted connects / clients" "$(st Aborted_connects) / $(st Aborted_clients)"
line "Threads_created per connection" "$(pct "$(st Threads_created)" "$(st Connections)")%  (high = raise thread_cache_size)"

hr "InnoDB"
bp=$(vr innodb_buffer_pool_size); line "Buffer pool size" "$(gb "$bp") GB"
rr=$(st Innodb_buffer_pool_read_requests); rd=$(st Innodb_buffer_pool_reads)
hit=$(awk -v r="$rr" -v d="$rd" 'BEGIN{ if (r==0) print "n/a"; else printf "%.2f", (1 - d/r)*100 }')
line "Buffer pool hit ratio" "${hit}%  (want > 99% on a warmed-up server)"
dsize=$($M -e "SELECT IFNULL(SUM(data_length+index_length),0) FROM information_schema.tables WHERE engine='InnoDB'")
line "InnoDB data+index on disk" "$(gb "$dsize") GB  $( awk -v d="$dsize" -v b="$bp" 'BEGIN{ if (d>b) print "(larger than the buffer pool)" }')"
line "Row lock waits / avg wait ms" "$(st Innodb_row_lock_waits) / $(st Innodb_row_lock_time_avg)"
line "innodb_flush_log_at_trx_commit" "$(vr innodb_flush_log_at_trx_commit)"
line "innodb_log_file_size" "$(gb "$(vr innodb_log_file_size)") GB"

hr "Queries"
q=$(st Questions); line "Questions per second (avg)" "$(awk -v q="$q" -v u="$up" 'BEGIN{printf "%.1f", q/u}')"
line "Slow queries" "$(st Slow_queries)  (slow_query_log=$(vr slow_query_log), long_query_time=$(vr long_query_time)s)"
line "Select full join / range check" "$(st Select_full_join) / $(st Select_range_check)  (joins without indexes)"
line "Sort merge passes" "$(st Sort_merge_passes)  (high = raise sort_buffer_size a little)"
line "Created tmp disk tables" "$(pct "$(st Created_tmp_disk_tables)" "$(st Created_tmp_tables)")% of tmp tables went to disk"
line "Table open cache hit" "$(pct "$(st Table_open_cache_hits)" "$(( $(st Table_open_cache_hits) + $(st Table_open_cache_misses) ))")%  (table_open_cache=$(vr table_open_cache))"
line "Open files / limit" "$(st Open_files) / $(vr open_files_limit)"

hr "Top $TOP tables by size"
$M -e "SELECT table_schema, table_name, engine, ROUND((data_length+index_length)/1048576,1) AS mb, table_rows FROM information_schema.tables WHERE table_schema NOT IN ('information_schema','performance_schema','mysql','sys') ORDER BY (data_length+index_length) DESC LIMIT $TOP" \
 | awk 'BEGIN{printf "  %-22s %-36s %-8s %10s %12s\n","SCHEMA","TABLE","ENGINE","MB","ROWS"} {printf "  %-22s %-36s %-8s %10s %12s\n",$1,substr($2,1,36),$3,$4,$5}'

hr "Non-InnoDB tables (MyISAM etc.)"
$M -e "SELECT engine, COUNT(*), ROUND(SUM(data_length+index_length)/1048576,1) FROM information_schema.tables WHERE table_schema NOT IN ('information_schema','performance_schema','mysql','sys') AND engine<>'InnoDB' GROUP BY engine" \
 | awk '{printf "  %-10s %6s tables %10s MB\n",$1,$2,$3} END{ if (NR==0) print "  none" }'

hr "Currently running (> 5s)"
$M -e "SELECT id, user, time, state, LEFT(info,90) FROM information_schema.processlist WHERE command<>'Sleep' AND time>5 ORDER BY time DESC LIMIT 10" \
 | awk -F'\t' '{printf "  #%-7s %-14s %5ss  %-20s %s\n",$1,$2,$3,$4,$5} END{ if (NR==0) print "  none" }'
294b5a598f5e54107baf85178e3a03aaf1ec61efd6ef171e311efeeaec8e10e0curl -fsSL -o mysql-health-snapshot.sh https://scr.srvscripts.com/mysql-health-snapshot/mysql-health-snapshot.sh && curl -fsSL https://scr.srvscripts.com/mysql-health-snapshot/mysql-health-snapshot.sh.sha256 | sha256sum -cInvoke-WebRequest -Uri 'https://scr.srvscripts.com/mysql-health-snapshot/mysql-health-snapshot.sh' -OutFile 'mysql-health-snapshot.sh'; if ((Get-FileHash 'mysql-health-snapshot.sh' -Algorithm SHA256).Hash -eq '294B5A598F5E54107BAF85178E3A03AAF1EC61EFD6EF171E311EFEEAEC8E10E0') { 'OK: the file is intact' } else { 'MISMATCH: do not run this file' }curl and sha256sum are not the Linux tools, so use the PowerShell line there.Also on GitHub: github.com/srvscripts/scripts
Frequently asked questions
How is the MySQL health snapshot different from mysqltuner?
It shows a handful of key ratios and the largest tables in seconds, with no Perl and no long list of generic advice.
Does it change any settings?
No. It only runs read-only status queries.
Does it work with MariaDB 11 and 12?
Yes, and with MySQL 8.0, 8.4 and 9.x.