A SIP trace shows exactly what happened on a call, but reading one takes practice: dozens of headers per message, retransmissions, and the one wrong address hidden in the SDP. This SIP trace analyzer reads the trace for you. Paste the messages from sngrep, Asterisk’s pjsip set logger on, the old sip set debug on, or tcpdump -A, and it lists the call flow, the codecs and media addresses, and the likely fault: NAT, a SIP ALG, a missing ACK, failed authentication, a codec mismatch or a scanner.
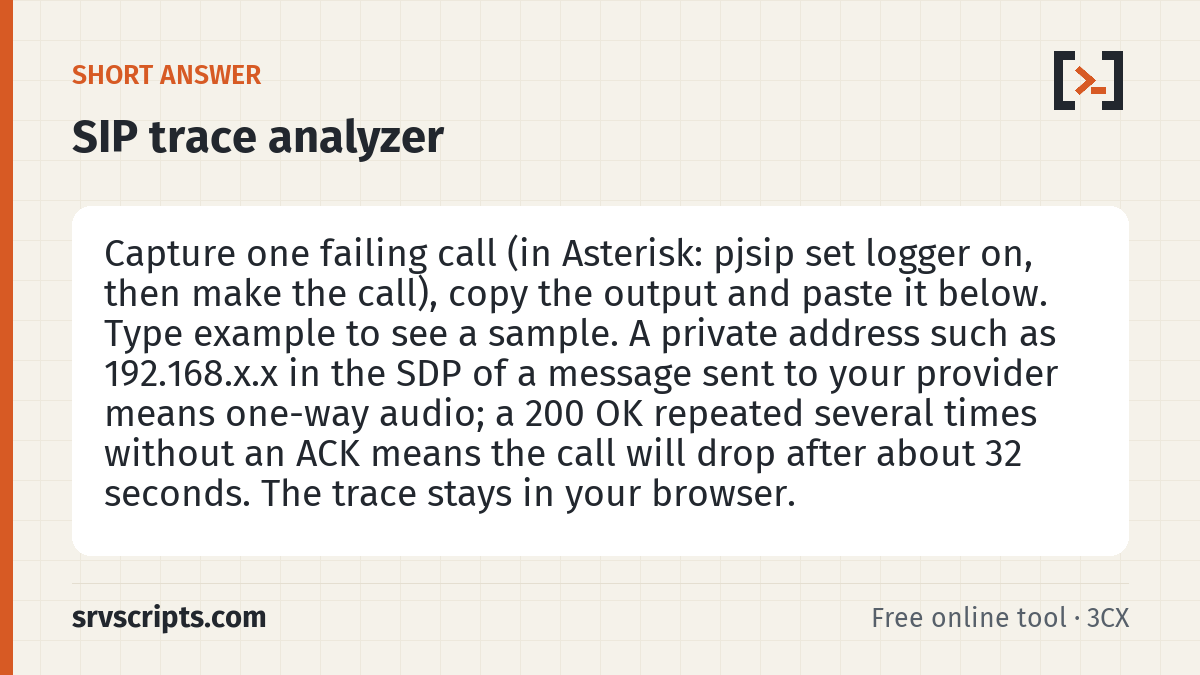
Short answer: Capture one failing call (in Asterisk: pjsip set logger on, then make the call), copy the output and paste it below. Type example to see a sample. A private address such as 192.168.x.x in the SDP of a message sent to your provider means one-way audio; a 200 OK repeated several times without an ACK means the call will drop after about 32 seconds. The trace stays in your browser.
Table of Contents
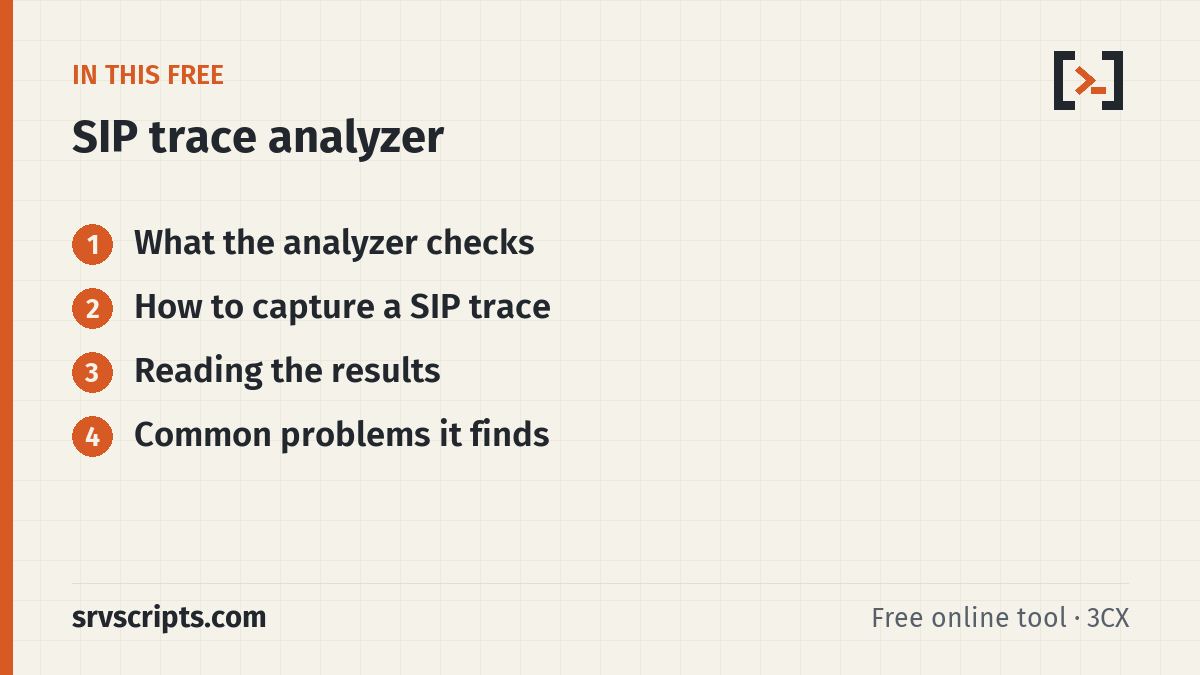
What the analyzer checks
- Call flow: every request and response in order, with direction and peer when the log shows them, and retransmissions.
- Result: the final response of each INVITE and REGISTER, explained with the SIP response codes table.
- NAT: private addresses in Contact and SDP sent to public peers, Via
receivedandrportshowing the public address, and headers and SDP that disagree (a sign of a SIP ALG). - Timers: a 200 OK repeated without an ACK, and a BYE about 32 seconds after answer.
- Media: offered and answered codecs, RFC 4733 DTMF, SRTP mismatches, and hold (sendonly or inactive).
- Security: requests from known SIP scanners such as friendly-scanner and sipvicious, and large INVITEs over UDP that may be fragmented.
How to capture a SIP trace
Asterisk and FreePBX (PJSIP)
asterisk -rvvv
pjsip set logger on              # all SIP traffic
pjsip set logger host 203.0.113.20   # or only one peer
# make the test call, then
pjsip set logger off
sngrep
sngrep -d any port 5060
# select the call, press F2 (Save), choose .txt, and paste the file here
tcpdump
tcpdump -i any -nn -s0 -A udp port 5060 > /tmp/sip.txtCapture one call at a time and, where you can, from the PBX itself, so the trace shows what the PBX sent and received. Mask phone numbers and passwords before sharing a trace with anyone; the analyzer itself never uploads it.
Reading the results
The Findings table comes first: red rows are faults that break calls, amber rows are risks or settings to change, and green rows are checks that passed. The SDP media table shows where each side asked to receive audio. For audio to flow both ways, each address must be reachable by the other side, so a PBX behind NAT has to advertise its public IP. The Message flow table is the ladder diagram in text form: look for repeated messages (retransmissions) and for the first 4xx, 5xx or 6xx.
Common problems it finds
| What you see | What it means | Fix |
|---|---|---|
| Private IP in the SDP of a message to the provider | Audio is sent to an address the far end cannot reach: one-way or no audio | Set external_media_address, external_signaling_address and local_net on the PJSIP transport |
| 200 OK repeated, no ACK, BYE after about 32 s | The ACK never reached the far end | Correct the Contact address, enable rport, disable SIP ALG |
| 401 or 407 again after credentials were sent | Wrong username, password or realm | Check the auth username and password |
| 488 or no common codec | Offer and answer share no codec | Allow ulaw/alaw on both sides |
| INVITE sent three or more times with no reply | Destination unreachable or blocked | Check the address, port and firewall |
| User-Agent friendly-scanner or sipvicious | Someone is scanning for weak passwords | Restrict SIP to known IPs and add fail2ban |
SIP trace analyzer at a glance
Official documentation: RFC 3261: SIP, RFC 3264: SDP offer/answer, sngrep, Asterisk documentation.
Related: SIP response codes · Fix one-way audio · Disable SIP ALG · SIP ports and firewall.
Frequently asked questions
Is my SIP trace uploaded anywhere?
No. The analyzer runs in your browser and the trace never leaves your computer. Still mask phone numbers and passwords before you share a trace with other people.
Which log formats can I paste?
Asterisk pjsip set logger output, chan_sip sip set debug output, sngrep text exports, tcpdump -A output and plain SIP messages copied from Wireshark (Follow UDP stream). Each message needs its first line: the request line or the SIP/2.0 status line.
Why does my call drop after exactly 32 seconds?
The far end answered with 200 OK but never received your ACK, so it kept retransmitting the 200 OK and gave up after the SIP timer of 64 × 500 ms. The ACK is going to the wrong address, usually because of NAT or a SIP ALG.
Why do I get one-way audio?
One side tells the other to send audio to an address it cannot reach, usually a private IP in the SDP from a PBX behind NAT, or the RTP ports are closed on the firewall. The analyzer flags private addresses in the SDP.