The MariaDB slow query log is the most useful file on a busy database server and the least read. After a day it holds thousands of entries, most of them the same three queries with different IDs, and scrolling through it tells you nothing about which one costs the most. pt-query-digest solves that, but it is a large Perl tool that is often not installed and not allowed on a customer’s server. This script does the part you need in Bash and awk: normalise every query, group the identical ones, and rank them.
Table of Contents
What it does
- Asks the server for
@@slow_query_log,@@slow_query_log_file,@@long_query_timeand@@log_output, so you see at once whether anything is being logged. A relative log file name is resolved against the datadir. - Parses the log in both the MariaDB and the MySQL 5.7/8.0 formats, including multi-line queries,
use db;lines and the header that is repeated after every restart. - Turns each query into a fingerprint: lower case, comments removed, numbers become
N, strings become'S',IN (1,2,3)lists becomeIN (...), multi-rowVALUEScollapse to one. - For each fingerprint: count, total, average and maximum
Query_time, lock time, and the ratio ofRows_examinedtoRows_sent. - Prints the top N by total time (or by count, average, maximum or ratio).
Usage
curl -fsSL https://srvscripts.com/get/mariadb-slow-query-summary/ -o mariadb-slow-query-summary.sh
bash mariadb-slow-query-summary.sh                        # find the log, top 10 by total time
bash mariadb-slow-query-summary.sh --top 20 --sort ratio  # worst index offenders first
bash mariadb-slow-query-summary.sh --tail 200000          # only the recent end of a huge log
bash mariadb-slow-query-summary.sh --no-db --log /root/slow-copy.log.gz
MYSQL_ARGS="-u admin -p" bash mariadb-slow-query-summary.sh
Sample output
== Server settings ==
  slow_query_log               ON
  slow_query_log_file          /var/lib/mysql/web1-slow.log
  long_query_time              1s
  log_output                   FILE

== Slow log ==
  File                         /var/lib/mysql/web1-slow.log (412M)
  Slow queries parsed          18342
  Distinct fingerprints        61
  Total query time             41877.310s
  Time span                    2026-09-23 00:00 .. 2026-09-30 23:59

== Top 10 by total ==

  #1   total  22410.55s  count 9120    avg    2.457s  max   11.093s  lock 0.912s
       rows examined/sent 7706400120/109440 (70416.2:1)   db shop_wp   user shop_wp
       select option_name, option_value from wp_options where autoload = 'S'

  #2   total   8120.02s  count 3301    avg    2.460s  max    6.210s  lock 0.140s
       rows examined/sent 825250110/3301 (250000.0:1)   db shop_wp   user shop_wp
       select sum(total) from wc_orders where created_at >= 'S' and customer_id in (...)
Two fingerprints are more than 70% of all the slow time in the week. The first is a WordPress site with an oversized, autoloaded wp_options table: the fix is cleaning up autoloaded options, not the database. The second examines 250,000 rows to return one; an index on (customer_id, created_at) turns that into a lookup. Take a real example of the query from the log, with its literal values, and run EXPLAIN on it before adding the index.
Tested on a real server
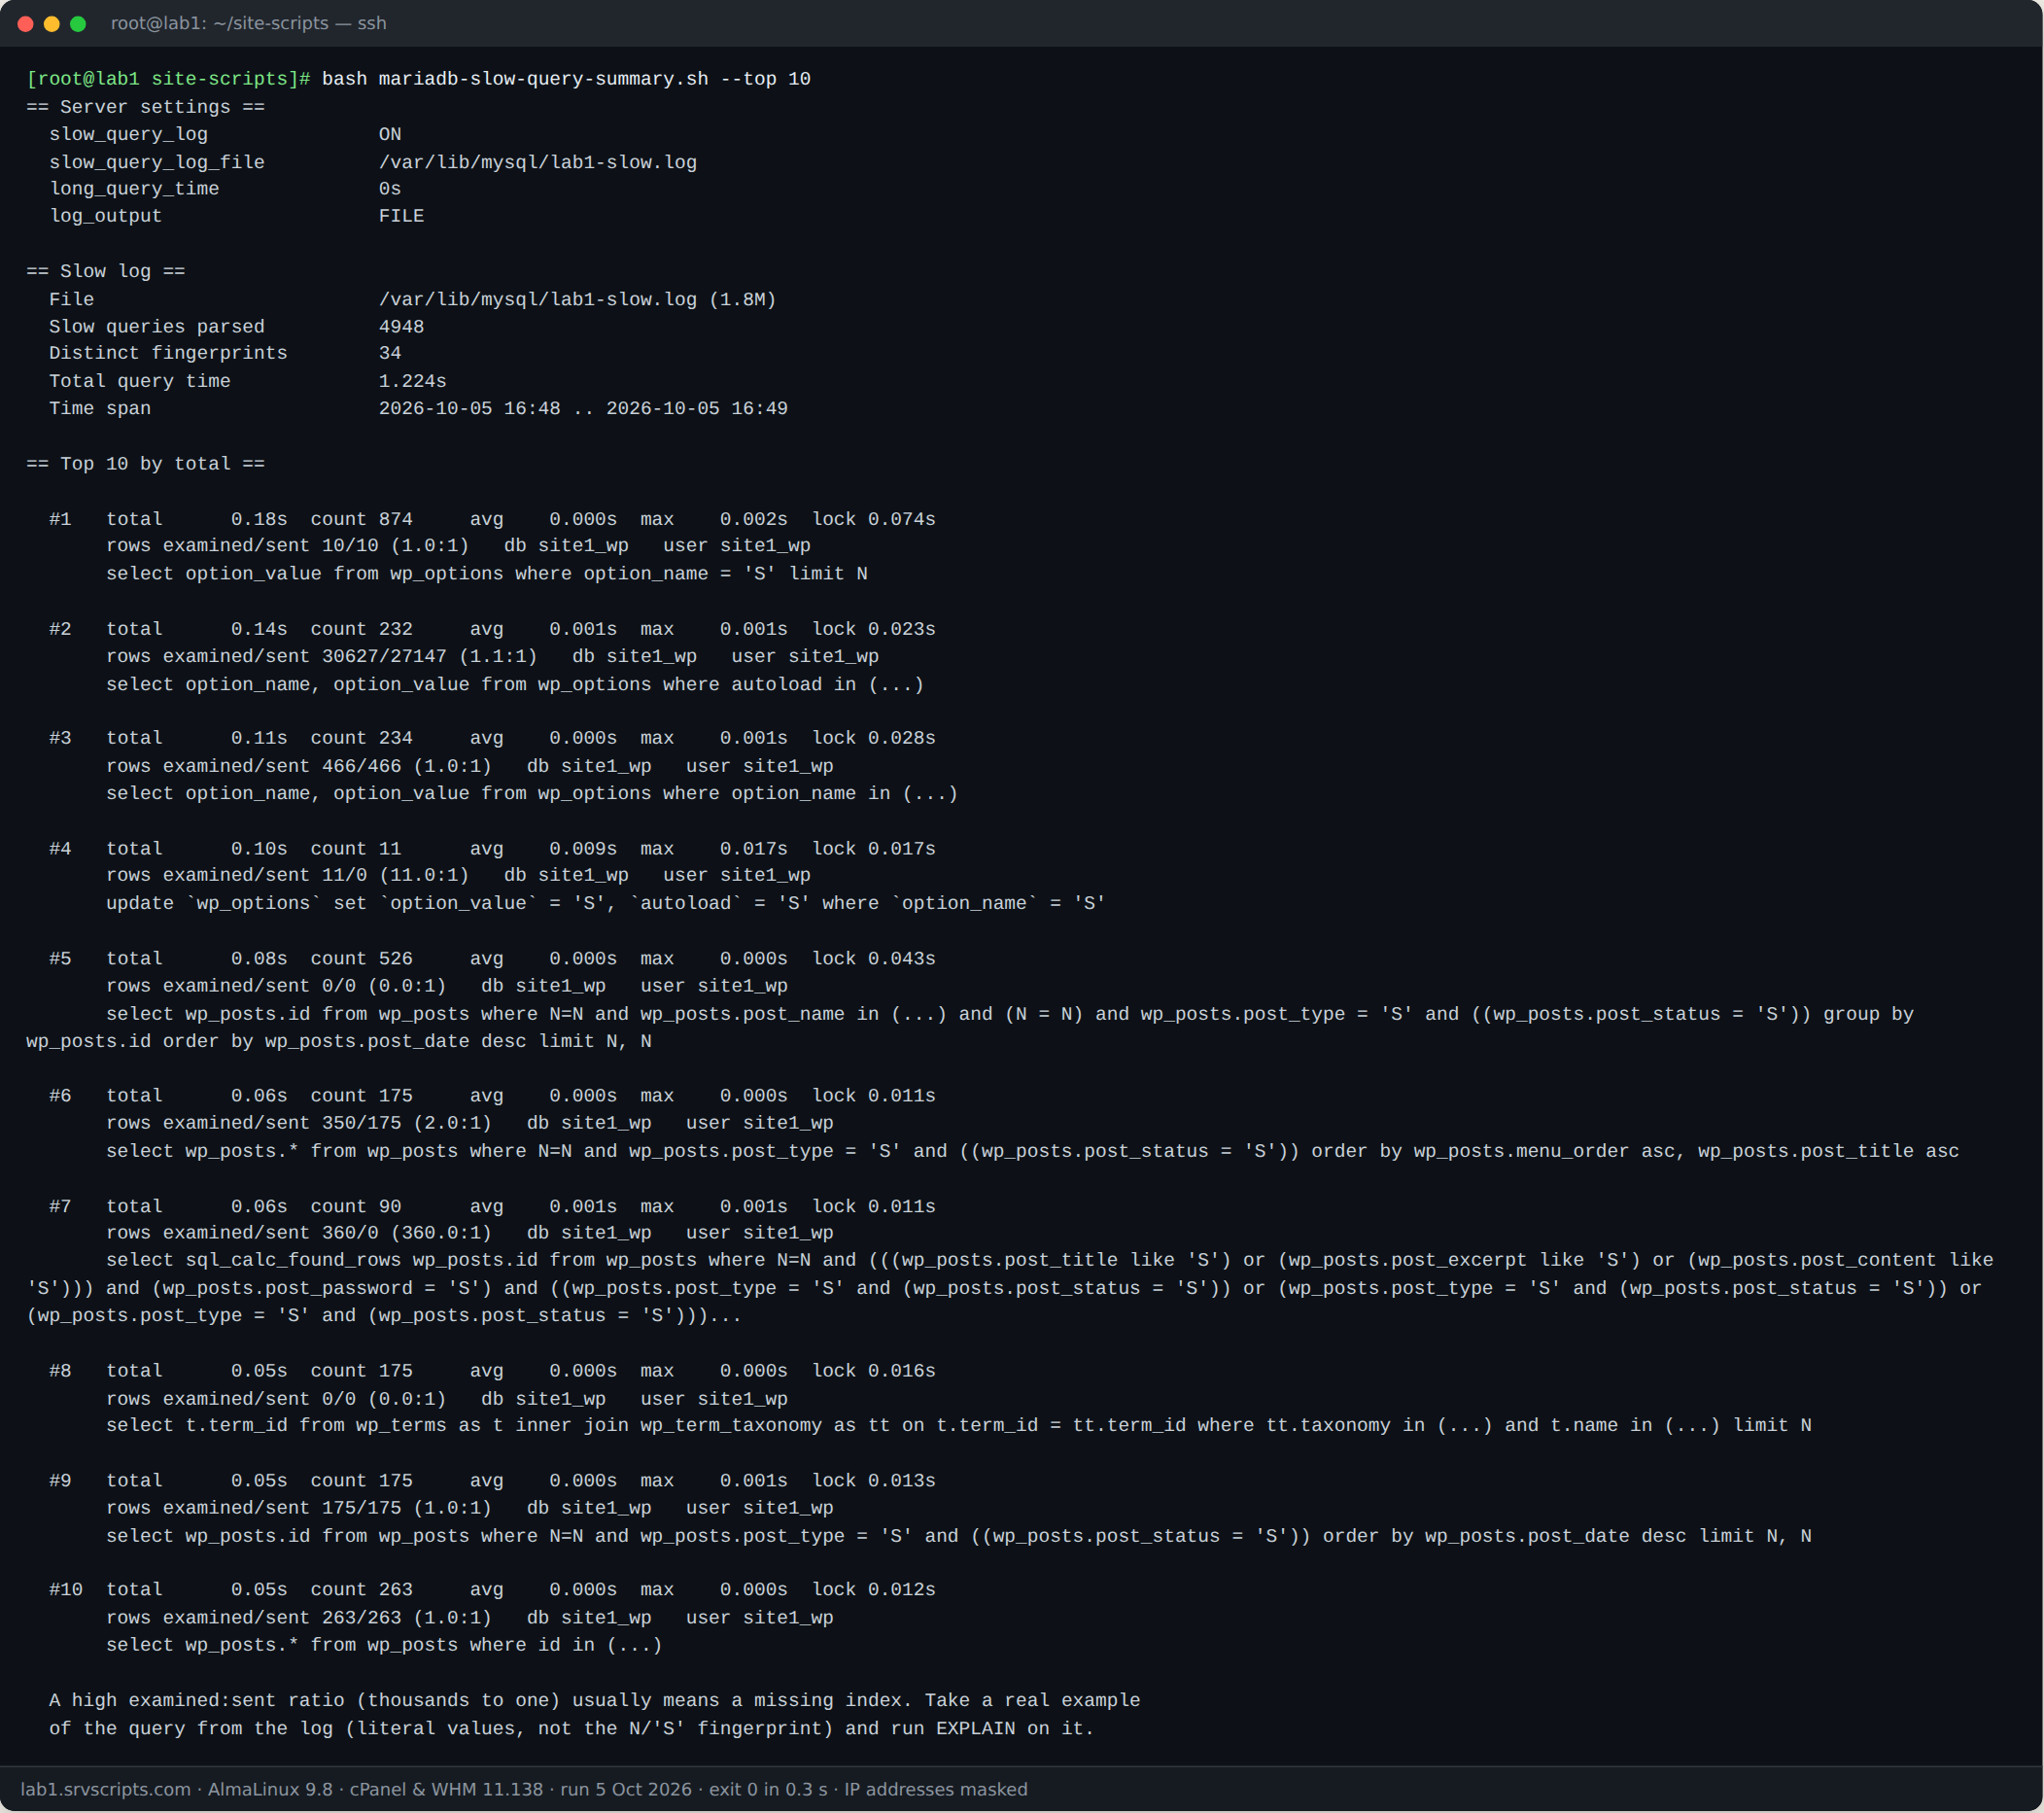
We ran this script on our lab server on 5 October 2026: AlmaLinux 9.8 with cPanel & WHM 11.138, MariaDB 10.11 and three WordPress test accounts. The screenshot is the real terminal output; only IP addresses are masked, and long output is cut where marked.
Options
--log FILE— read this file instead of asking the server (.gzfiles are read withzcat).--top N— number of fingerprints to show (10).--sort total|count|avg|max|ratio— ranking (total query time by default).--tail LINES— parse only the last LINES lines; useful on logs of several GB.--width N— truncate long fingerprints (400 characters).--no-db— do not connect to the server at all.
Enabling the MariaDB slow query log
When logging is off, the script prints the commands instead of running them:
SET GLOBAL slow_query_log_file = '/var/lib/mysql/web1-slow.log';
SET GLOBAL long_query_time = 1;
SET GLOBAL slow_query_log = ON;
Add the same three settings under [mysqld] in my.cnf to keep them after a restart. The MariaDB slow query log documentation covers the extra options such as log_slow_verbosity.
Notes
The script is read-only: it never changes a setting, even when logging is off, and never runs a query from the log. It needs read access to the log file, which is usually owned by mysql, so run it as root. Exit code 1 means slow_query_log is OFF, which lets a cron job notice when someone disabled logging; 2 means the log could not be found or read. The fingerprinting is simpler than pt-query-digest (it does not rewrite ORDER BY or alias differences), so two spellings of the same query can appear separately. For the server-wide ratios that go with this report, run MySQL / MariaDB Health Snapshot.
MariaDB slow query log at a glance
Official documentation: MariaDB documentation, cPanel & WHM documentation, AlmaLinux wiki.
Related guides: Disk full on a production server: recovery runbook · MySQL/MariaDB won’t start: crash recovery runbook · MariaDB Not Starting After Upgrade: 5 Proven Recovery Fixes.
The script
#!/usr/bin/env bash
# MariaDB Slow Query Log Summary (v1.0.0) - from srvScripts.com
# Source, docs and updates: https://srvscripts.com/scripts/mariadb-slow-query-summary/
# Copyright (c) 2026 srvScripts.com. MIT licence: if you copy, share or adapt this script, keep this notice and credit srvScripts.com.
# mariadb-slow-query-summary.sh — group the MariaDB/MySQL slow query log by query shape, no Percona tools needed
# https://srvscripts.com/scripts/mariadb-slow-query-summary/   License: MIT
#
# Read-only. Finds the slow log via SELECT @@slow_query_log_file (or use --log), normalises every
# query into a fingerprint (numbers -> N, strings -> 'S', IN lists collapsed) and ranks the
# fingerprints by total time. Uses the mysql/mariadb client with whatever credentials it already
# has (/root/.my.cnf on cPanel), or MYSQL_ARGS="-u admin -p".
#   bash mariadb-slow-query-summary.sh
#   bash mariadb-slow-query-summary.sh --top 20 --sort count
#   bash mariadb-slow-query-summary.sh --log /var/lib/mysql/host-slow.log --tail 200000
# Exit codes: 0 report printed, 1 slow_query_log is OFF on the server, 2 usage error or log not readable.
set -uo pipefail
export LC_ALL=C

LOG=""; TOP=10; SORT=total; TAIL=0; WIDTH=400; NODB=0

usage() {
  cat <<'EOF'
Usage: mariadb-slow-query-summary.sh [options]
  --log FILE        slow log to read (default: ask the server for @@slow_query_log_file)
  --top N           how many fingerprints to show (default 10)
  --sort KEY        total | count | avg | max | ratio (default total = total Query_time)
  --tail LINES      only parse the last LINES lines of the log (fast on huge logs)
  --width N         truncate fingerprints to N characters (default 400)
  --no-db           do not connect to the server (only parse --log)
  -h, --help        this help
Environment: MYSQL_ARGS extra arguments for the mysql client, e.g. "-u admin -p"
EOF
}
need_arg() { [[ $# -ge 2 && -n "$2" ]] || { echo "Option $1 needs a value" >&2; exit 2; }; }
while [[ $# -gt 0 ]]; do
  case "$1" in
    --log) need_arg "$@"; LOG=$2; shift 2 ;;
    --top) need_arg "$@"; TOP=$2; shift 2 ;;
    --sort) need_arg "$@"; SORT=$2; shift 2 ;;
    --tail) need_arg "$@"; TAIL=$2; shift 2 ;;
    --width) need_arg "$@"; WIDTH=$2; shift 2 ;;
    --no-db) NODB=1; shift ;;
    -h|--help) usage; exit 0 ;;
    *) echo "Unknown option: $1 (try --help)" >&2; exit 2 ;;
  esac
done
for n in "$TOP" "$TAIL" "$WIDTH"; do [[ "$n" =~ ^[0-9]+$ ]] || { echo "Expected a number, got '$n'" >&2; exit 2; }; done
case "$SORT" in total) KEY=1 ;; count) KEY=2 ;; avg) KEY=3 ;; max) KEY=4 ;; ratio) KEY=8 ;;
  *) echo "--sort must be total, count, avg, max or ratio" >&2; exit 2 ;; esac

hr() { printf '\n== %s ==\n' "$*"; }
line() { printf '  %-28s %s\n' "$1" "$2"; }

# ---- server settings ---------------------------------------------------------------------------
read -ra MARGS <<< "${MYSQL_ARGS:-}"
CLIENT=$(command -v mariadb || command -v mysql || true)
SLOW_ON=""; LQT=""; OUTPUT=""; DATADIR=""; SRVFILE=""
if (( ! NODB )); then
  if [[ -z "$CLIENT" ]]; then
    echo "skipped: mysql/mariadb client not installed (server settings unknown)"
  elif vals=$("$CLIENT" "${MARGS[@]}" -N -B -e 'SELECT @@slow_query_log, @@slow_query_log_file, @@long_query_time, @@log_output, @@datadir, @@hostname' 2>/dev/null); then
    IFS=$'\t' read -r SLOW_ON SRVFILE LQT OUTPUT DATADIR HOST <<< "$vals"
    # a relative file name is relative to the datadir
    [[ -n "$SRVFILE" && "$SRVFILE" != /* ]] && SRVFILE="${DATADIR%/}/$SRVFILE"
    LQT=$(awk -v v="$LQT" 'BEGIN{ print v + 0 }')                 # 10.000000 -> 10
    hr "Server settings"
    line "slow_query_log" "$([[ "$SLOW_ON" == 1 ]] && echo ON || echo OFF)"
    line "slow_query_log_file" "$SRVFILE"
    line "long_query_time" "${LQT}s"
    line "log_output" "$OUTPUT"
    [[ "$OUTPUT" == *FILE* ]] || line "  !! log_output" "has no FILE, so nothing is written to the log file"
    if [[ "$SLOW_ON" != 1 ]]; then
      hr "How to enable it (printed only, not run)"
      cat <<EOF
  Run in the mysql client (takes effect at once; long_query_time applies to new connections):
    SET GLOBAL slow_query_log_file = '${SRVFILE:-${DATADIR%/}/${HOST}-slow.log}';
    SET GLOBAL long_query_time = 1;
    SET GLOBAL slow_query_log = ON;
  To keep it after a restart, add under [mysqld] in my.cnf (/etc/my.cnf or /etc/mysql/mariadb.conf.d/50-server.cnf):
    slow_query_log = 1
    slow_query_log_file = ${SRVFILE:-${DATADIR%/}/${HOST}-slow.log}
    long_query_time = 1
EOF
    fi
  else
    echo "skipped: cannot connect with '$CLIENT ${MYSQL_ARGS:-}' (set MYSQL_ARGS, or use --no-db with --log)"
  fi
fi

[[ -n "$LOG" ]] || LOG=$SRVFILE
[[ -n "$LOG" ]] || { echo "No slow log found. Pass --log FILE." >&2; exit 2; }
if [[ ! -r "$LOG" ]]; then
  if [[ "$SLOW_ON" == 0 && ! -e "$LOG" ]]; then echo; echo "The slow log is OFF and $LOG does not exist yet: nothing to summarise."; exit 1; fi
  echo "Cannot read $LOG (run as root, or pass --log)" >&2; exit 2
fi

# ---- parser --------------------------------------------------------------------------------------
# One record per "# User@Host:" header; "# Query_time:" gives the numbers; every following line that
# is not a comment, "use db;" or "SET timestamp=" is query text. Output: one tab-separated line per
# fingerprint: total count avg max lock rows_examined rows_sent ratio db user fingerprint
# and a final "#SUMMARY" line.
AWK_PROG=$(cat <<'AWK'
function numnorm(s,   out, pre) {
  out = ""
  while (match(s, /(^|[^a-z0-9_$.])-?[0-9]+(\.[0-9]+)?/)) {
    pre = substr(s, RSTART, 1)
    if (pre ~ /[0-9-]/ && RSTART == 1) pre = ""
    out = out substr(s, 1, RSTART - 1) pre "N"
    s = substr(s, RSTART + RLENGTH)
  }
  return out s
}
function fingerprint(q) {
  q = tolower(q)
  gsub(/\/\*([^*]|\*+[^*\/])*\*+\//, " ", q)          # /* comments */
  gsub(/'([^'\\]|\\.|'')*'/, "'S'", q)                  # 'strings' incl. '' and \' escapes
  gsub(/"([^"\\]|\\.)*"/, "'S'", q)                     # "strings"
  gsub(/0x[0-9a-f]+/, "N", q)                           # hex literals
  q = numnorm(q)
  gsub(/[ \t\r\n]+/, " ", q)
  gsub(/ *, */, ", ", q); gsub(/\( */, "(", q); gsub(/ *\)/, ")", q)
  gsub(/ in *\((N|'S'|null)(, (N|'S'|null))*\)/, " in (...)", q)
  gsub(/values *\([^)]*\)(, \([^)]*\))*/, "values (...)", q)
  sub(/^ /, "", q); sub(/[ ;]+$/, "", q)
  return q
}
function flush(   fp) {
  if (have && query != "") {
    fp = fingerprint(query)
    cnt[fp]++; tot[fp] += qt; lck[fp] += lt; rex[fp] += re; rsn[fp] += rs
    if (qt > mx[fp]) mx[fp] = qt
    if (!(fp in dbn)) { dbn[fp] = (db == "" ? "-" : db); usr[fp] = (user == "" ? "-" : user) }
    n++; alltime += qt
  }
  have = 0; query = ""; qt = lt = re = rs = 0
}
/^# Time:/            { flush(); next }
/^# User@Host:/       { flush(); user = $3; sub(/\[.*/, "", user); next }
/^# Thread_id:.*Schema:/ { for (i = 1; i <= NF; i++) if ($i == "Schema:") db = $(i + 1); next }
/^# Query_time:/      { have = 1
                        for (i = 1; i < NF; i++) {
                          if ($i == "Query_time:") qt = $(i + 1) + 0
                          if ($i == "Lock_time:") lt = $(i + 1) + 0
                          if ($i == "Rows_sent:") rs = $(i + 1) + 0
                          if ($i == "Rows_examined:") re = $(i + 1) + 0
                        }
                        next }
/^#/                  { next }
/^SET timestamp=[0-9]+;$/ { ts = substr($0, 15) + 0; if (!first || ts < first) first = ts; if (ts > last) last = ts; next }
/^use [^ ]+;$/        { db = substr($2, 1, length($2) - 1); gsub(/`/, "", db); next }
/(mysqld|mariadbd).*Version:.*started with:$/ || /^Tcp port:/ || /^Time +Id +Command +Argument/ { next }
have                  { query = (query == "" ? $0 : query " " $0) }
END {
  flush()
  for (fp in cnt) {
    ratio = rex[fp] / (rsn[fp] > 0 ? rsn[fp] : 1)
    printf "%.6f\t%d\t%.6f\t%.6f\t%.6f\t%d\t%d\t%.1f\t%s\t%s\t%s\n", tot[fp], cnt[fp], tot[fp] / cnt[fp], mx[fp], lck[fp], rex[fp], rsn[fp], ratio, dbn[fp], usr[fp], fp
    u++
  }
  printf "#SUMMARY\t%d\t%d\t%.3f\t%d\t%d\n", n, u, alltime, first, last
}
AWK
)

reader() {
  if [[ "$LOG" == *.gz ]]; then zcat -- "$LOG"; else cat -- "$LOG"; fi
}
RESULT=$(if (( TAIL > 0 )); then reader | tail -n "$TAIL"; else reader; fi | awk "$AWK_PROG")

# ---- report --------------------------------------------------------------------------------------
IFS=$'\t' read -r _ NQ NFP TTIME FIRST LAST <<< "$(grep '^#SUMMARY' <<< "$RESULT")"
fmt_ts() { [[ "$1" =~ ^[1-9][0-9]*$ ]] && date -d "@$1" '+%Y-%m-%d %H:%M' || echo "?"; }
hr "Slow log"
line "File" "$LOG ($(du -h -- "$LOG" | cut -f1))"
(( TAIL > 0 )) && line "Parsed" "last $TAIL lines only"
line "Slow queries parsed" "${NQ:-0}"
line "Distinct fingerprints" "${NFP:-0}"
line "Total query time" "${TTIME:-0}s"
line "Time span" "$(fmt_ts "${FIRST:-0}") .. $(fmt_ts "${LAST:-0}")"

if (( ${NQ:-0} > 0 )); then
  hr "Top $TOP by $SORT"
  grep -v '^#SUMMARY' <<< "$RESULT" | sort -t $'\t' -k"$KEY","$KEY"gr | head -n "$TOP" |
  awk -F'\t' -v w="$WIDTH" '{
      fp = $11; if (length(fp) > w) fp = substr(fp, 1, w) "..."
      printf "\n  #%-3d total %9.2fs  count %-7d avg %8.3fs  max %8.3fs  lock %.3fs\n", NR, $1, $2, $3, $4, $5
      printf "       rows examined/sent %d/%d (%s:1)   db %s   user %s\n", $6, $7, $8, $9, $10
      printf "       %s\n", fp }'
  echo
  echo "  A high examined:sent ratio (thousands to one) usually means a missing index. Take a real example"
  echo "  of the query from the log (literal values, not the N/'S' fingerprint) and run EXPLAIN on it."
fi
[[ -n "$SLOW_ON" && "$SLOW_ON" != 1 ]] && exit 1
exit 0
73800aba5caed6d7845f83663f84f9fb9e3f63add90f60b2bec1148fd357f98bcurl -fsSL -o mariadb-slow-query-summary.sh https://scr.srvscripts.com/mariadb-slow-query-summary/mariadb-slow-query-summary.sh && curl -fsSL https://scr.srvscripts.com/mariadb-slow-query-summary/mariadb-slow-query-summary.sh.sha256 | sha256sum -cInvoke-WebRequest -Uri 'https://scr.srvscripts.com/mariadb-slow-query-summary/mariadb-slow-query-summary.sh' -OutFile 'mariadb-slow-query-summary.sh'; if ((Get-FileHash 'mariadb-slow-query-summary.sh' -Algorithm SHA256).Hash -eq '73800ABA5CAED6D7845F83663F84F9FB9E3F63ADD90F60B2BEC1148FD357F98B') { 'OK: the file is intact' } else { 'MISMATCH: do not run this file' }curl and sha256sum are not the Linux tools, so use the PowerShell line there.Also on GitHub: github.com/srvscripts/scripts
Frequently asked questions
Does it work with MySQL 8 as well as MariaDB?
Yes. It reads both log formats and uses the same @@slow_query_log_file variable, which exists in MariaDB and MySQL.
What long_query_time should I use?
Start with 1 second on a busy server and lower it to 0.5 once the worst queries are fixed. 0 logs everything and grows the file very quickly.
The log is 5 GB. Will this take forever?
No. In our tests a 120 MB log with 400,000 entries took about 10 seconds. For multi-GB logs use --tail 500000 to look at recent traffic, and rotate the log with logrotate.
What does a high examined-to-sent ratio mean?
The server read far more rows than it returned, which almost always means a missing or unusable index for that WHERE clause.