PHP-FPM is the default PHP handler on new cPanel installs, but the defaults it ships with are conservative and most servers still have a handful of sites running under the old suPHP or LSAPI handlers from earlier migrations. Getting real performance from it means matching the pool sizes to memory, picking an MPM that suits FPM, and enabling OPcache properly. The steps below apply to EasyApache 4 on cPanel 134 and 138 with PHP 8.2 to 8.4.
Table of Contents
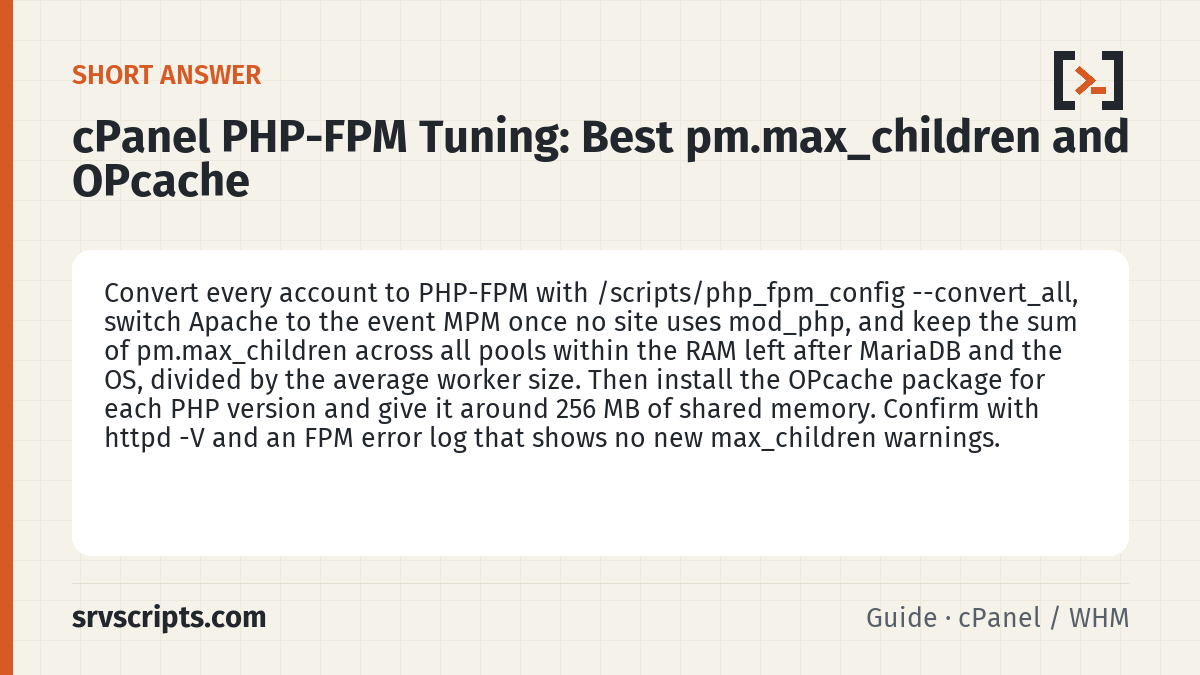
Short answer: Convert every account to PHP-FPM with /scripts/php_fpm_config --convert_all, switch Apache to the event MPM once no site uses mod_php, and keep the sum of pm.max_children across all pools within the RAM left after MariaDB and the OS, divided by the average worker size. Then install the OPcache package for each PHP version and give it around 256 MB of shared memory. Confirm with httpd -V and an FPM error log that shows no new max_children warnings.
Switch the handler and confirm the MPM
Check what each PHP version is currently using:
whmapi1 php_get_handlers
whmapi1 php_get_vhosts_by_version version=ea-php84
Turn PHP-FPM on for every site in one go from WHM » Software » MultiPHP Manager » System PHP-FPM, or from the shell:
whmapi1 php_set_default_accounts_to_fpm default_accounts_to_fpm=1
/scripts/php_fpm_config --convert_all
PHP-FPM works with any of the three Apache MPMs, but the choice matters. prefork is the safe legacy option and is required if you still run mod_php. Once everything is on FPM there is no reason to keep it: switch to event, which handles keep-alive connections without holding a full process per idle client. In EasyApache 4, select the ea-apache24-mod_mpm_event package and deselect mod_mpm_prefork; the provision step restarts Apache. Confirm with:
httpd -V | grep -i mpmIf you use LiteSpeed Enterprise instead of Apache, the MPM section does not apply, but the FPM pool sizing below still does when LiteSpeed is configured to use FPM rather than its own LSAPI.
Size pm.max_children from memory, not guesswork
cPanel assigns each account its own FPM pool, so the total worker count across all pools is what you must keep within RAM. The formula is simple: measure the average resident size of a PHP-FPM worker, subtract what MySQL, Apache, mail and the OS need, and divide.
ps -ylC php-fpm --sort:rss | awk '{sum+=$8; n++} END {print sum/n/1024 " MB average"}'
free -m
On a typical WordPress-heavy server a worker sits between 40 and 90 MB. With 16 GB of RAM, MariaDB taking 4 GB and 2 GB reserved for everything else, you have about 10 GB for PHP, which is roughly 130 workers at 75 MB each. That is the ceiling for the sum of pm.max_children across all pools, not per pool.
cPanel’s pool defaults are set at the system level under MultiPHP Manager » System PHP-FPM Configuration (pm.max_children, pm.max_requests, pm.process_idle_timeout). The defaults are pm = ondemand, max_children = 5, idle timeout 10 seconds. ondemand is correct for shared hosting because idle pools consume nothing. For the small number of busy sites, raise the pool value per domain in MultiPHP Manager » PHP-FPM settings for that domain, or write a YAML override:
cat > /var/cpanel/userdata/USERNAME/example.com.php-fpm.yaml <<'EOF'
---
_is_present: 1
pm_max_children: 20
pm_max_requests: 500
pm_process_idle_timeout: 30
php_admin_value_memory_limit: { name: 'php_admin_value[memory_limit]', value: 256M }
EOF
/scripts/php_fpm_config --rebuild
/scripts/restartsrv_apache_php_fpm
Set pm.max_requests to a few hundred on every pool. It recycles workers before memory leaks in extensions accumulate, which is the usual cause of workers slowly growing to 300 MB.
Diagnose 503s and “server reached max_children”
When a site returns 503 under load, the FPM log tells you why:
grep -h "max_children" /opt/cpanel/ea-php84/root/usr/var/log/php-fpm/error.log | tailA line saying the pool “reached pm.max_children setting” means that site needs a larger pool or its code needs fixing, usually slow database queries or an external HTTP call inside every page load. Do not simply raise max_children to 50 for every site; you will trade 503s for swap. Raise it on the one pool that needs it and look at why requests are slow. Enabling the slow log per pool helps:
php_admin_value_slowlog: { name: 'request_slowlog_timeout', value: '5s' }A common pitfall is a site with a large max_children but a memory_limit of 512 MB set by a plugin; the worst case is pool size multiplied by memory limit, and 20 workers at 512 MB is 10 GB from one account.
Enable and size OPcache
OPcache is the largest single win for PHP throughput and it is disabled by default in EasyApache. Install ea-php84-php-opcache (and the equivalent for other versions) via EasyApache 4, then set sensible values in MultiPHP INI Editor » Editor mode for each version, or in the system php.ini for that version:
opcache.enable=1
opcache.memory_consumption=256
opcache.interned_strings_buffer=32
opcache.max_accelerated_files=50000
opcache.validate_timestamps=1
opcache.revalidate_freq=60
opcache.jit=off
The 256 MB is shared across all workers of that PHP version, not per worker, so it is cheap. max_accelerated_files must exceed the total PHP file count of all sites on that version; 50,000 covers a few hundred WordPress installs. Leave the JIT off on shared servers: it adds memory per worker and rarely helps typical CMS workloads.
Check hit rates after a day with a one-line script in any site:
php -r 'print_r(opcache_get_status(false)["opcache_statistics"]);'A hit rate below 95% or frequent restarts (oom_restarts, hash_restarts) means the cache is too small.
Verify
Load-test a representative site with ab -n 500 -c 20 https://example.com/ before and after and compare the requests-per-second figure. Watch free -m and sar -r 1 30 during the test; swap usage should stay at zero. Confirm the MPM with httpd -V, confirm every domain is on FPM with whmapi1 php_get_vhosts_by_version version=ea-php84 | grep -c php_fpm, and look for zero new max_children lines in the FPM error log over a normal day. If the server is still slow after this, the bottleneck is usually the database; our MySQL health snapshot script and the LiteSpeed cache guide are the next stops.
CPanel PHP-FPM tuning at a glance
Official documentation: cPanel & WHM documentation, Linux man pages.
Related guides: Fix “Too many connections” on MariaDB/MySQL (cPanel) · CloudLinux 10 on cPanel: CageFS, LVE limits and what changed from CloudLinux 9 · MariaDB won’t start after an upgrade: InnoDB recovery, mariadb-upgrade and sql_mode issues.
Frequently asked questions
Does PHP-FPM tuning on cPanel also apply to LiteSpeed Enterprise servers?
Partly. LiteSpeed replaces Apache, so the MPM choice does not apply, but when LiteSpeed is configured to use PHP-FPM pools rather than LSAPI the pm.max_children and OPcache sizing described here still holds.
How long does converting all cPanel accounts to PHP-FPM take?
/scripts/php_fpm_config --convert_all usually completes in a few minutes on a server with a few hundred accounts, followed by one Apache restart; sites stay online apart from that brief restart.
Can I undo the switch to PHP-FPM or the event MPM?
Yes. Set the handler back per PHP version in MultiPHP Manager or with whmapi1 php_set_handler, and reselect mod_mpm_prefork in EasyApache 4; per-domain YAML overrides can be deleted and the pools rebuilt with /scripts/php_fpm_config --rebuild.